

 Annual Report 2025
CHIEF FINANCIAL OFFICER'S REVIEW
Utmost Group delivered strong results for 2025, driven by our strengthened franchise following the inclusion of Utmost Luxembourg as part of the Group. Our business benefitted from growing global client demand for our long-term wealth solutions underpinned by a market environment that experienced, improving investment markets, reductions in central bank rates and continued uncertainty in fiscal and tax policy.
The results show substantial improvements across our KPIs as we continue to grow the business and build on our resilient fee-based business model. Increases in AUA, operating profit and net flows have been driven by strong business performance across our global footprint, high client retention rates and favourable investment markets.
In December 2025 we announced the sale of Utmost Life and Pensions (“ULP”), this strategic disposal enhances Utmost’s focus as a market-leading wealth solutions business. As a result of the nnouncement the results of ULP are presented as discontinued operations in the financial statements.
The financial performance of the Group is assessed using a variety of financial measures (see pages 20 and 21 of the Strategic Report). Our core financial KPIs and client retention are discussed in detail below. The majority of these KPIs are considered alternative performance measures (“APMs”) and are reconciled back to audited IFRS information on pages 156-157 of this Annual Report. The figures in this section subject to statutory audit are IFRS Profit after Tax, IFRS equity and IFRS expenses.
INTRODUCTION
| Opening AUA 1 Jan |
Inflow | Outflow | Net Flow | Market | Closing AUA 31 Dec |
|
|---|---|---|---|---|---|---|
| FY 2025 | 103.5 | 9.7 | (7.1) | 2.6 | 10.2 | 116.3 |
| Proforma FY 2024 | 97.5 | 6.8 | (7.5) | (0.7) | 6.8 | 103.5 |
Figure 1: AUA analysis showing UWS net flows (in £bn)
| 2025 total |
2024 total |
|
|---|---|---|
| UWS AUA (£bn) | 116.3 | 103.5 |
| UGP Operating Profit (£m)* | 224 | 176 |
| UWS Gross Flows (£bn)** | 9.7 | 6.8 |
| UWS Net Flows (£bn)** | 2.6 | (0.7) |
| UWS Client Retention | 93% | 92% |
| UWS Revenue Margin** | 0.39% | 0.43% |
| UWS Operating Profit Margin | 46% | 48% |
| UGP SII EV (£m) | 2,602 | 2,392 |
| UGP Value of New Business (£m) | 83 | 59 |
| UGP Solvency Coverage Ratio | 167% | 175% |
| UGP Operating Cash Generation (£m)* | 177 | 142 |
| UGP Profit after Tax (£m)* | 20 | 556 |
Figure 2: Key performance indicators
* The operating profit of £176m, operating cash generation of £142m, profit after tax of £556m and value of new business of £59m in 2024 exclude the contribution of ULP. Including ULP in 2024, the operating profit was £190m, the operating cash generation was £156m, the profit after tax was £564m and the value of new business was £63m.
** The 2024 outcomes for these KPIs are presented including a full 2024 contribution from Utmost Luxembourg to make comparison with the 2025 outcomes more meaningful.
ASSETS UNDER ADMINISTRATION AND GROSS AND NET FLOWS
2025 was a record-breaking year for Utmost, with our teams delivering £9.7bn of inflows, an increase of 43% on last year. The momentum we saw in the first half of the year was sustained into the second half, with the periods recording £5.3bn and £4.4bn of inflows respectively.
Performance across our markets was driven by Utmost’s strengthened franchise following the successful integration and rebrand of Lombard International and our ability to serve the rising demand for long-term wealth solutions globally. Our diversified global footprint supports resilience across market cycles and enables us to tailor our proposition to local client needs, adviser models and regulatory environments. This was reflected in our results with six of our seven sales regions delivering double-digit growth in the year.
The UK was a standout market in 2025 delivering +100% growth in gross flows year-on-year. The pervasive uncertainty from rumours on fiscal and tax policy ahead of the Autumn Budget reinforced demand for advice-led, long-term wealth solutions. As a result, we saw clients and advisers accelerate planning activity as they looked to mitigate against the impact of potential changes. Utmost’s long-term, multi-generational specialist solutions are well aligned to those needs, supporting the strong growth experienced in the UK throughout 2025.
The majority of the UWS YE 2025 AUA is held in respect of UK and Continental Europe based clients, with the remainder from international market clients. We expect AUA to continue growing across all regions as the business continues to invest in growing distribution and expanding product development globally.
Our UWS platform offers clients and advisers access to a full range of asset classes, enabling them to tailor their investments to meet their risk and return appetites. The majority of our solutions utilise Open Architecture that offers clients or their advisers a broad selection of asset classes including funds, bonds and even access to alternative assets – such as hedge funds, private equity and real estate funds – in some jurisdictions.
Whilst the vast majority of the Group’s assets are backing unit-linked policies within our UWS business, there is a small proportion of other assets backing unit-linked business in ULP, pension and savings products within the UCS business and non-linked business within ULP and Utmost Worldwide (“UW”) in Guernsey.
CLIENT RETENTION
The Group has revised the calculation of the client retention KPI in 2025 to be based upon a measure of client assets retained as opposed to client numbers. The calculation of this revised KPI is set out on page 157 of the annual report. The Group uses client retention as a measure of client experience. High retention rates are driven by a strong proposition and good client service, as well as the inherent product features, where some benefits may be lost, or tax payments crystallised upon early surrender. Given the relative size of the Group’s business segments, the KPI is measured solely looking at UWS client retention. UWS’ client retention for 2025 was 93%, slightly higher than the 92% achieved in 2024.
REVENUE MARGIN
UWS revenue margin as an APM is calculated as the total insurance and unit-linked revenue on UWS business divided by the average UWS AUA for the year. The vast majority of UWS revenue in 2025 was £408m of fees and charges on UWS unit-linked business with a smaller contribution of £24m from UWS insurance revenue, giving total UWS revenue of £432m. It should be noted that the calculation of UWS revenue excludes the investment return earned on shareholder net assets and the shareholders’ share of the interest earned on transaction account assets. Average UWS AUA was £109.9bn in 2025, giving a UWS Revenue Margin for the year of 0.39%.
The Utmost Luxembourg business is weighted more heavily towards UHNW business with lower fees than those typically seen in the rest of Utmost. In order to make the comparison with 2025 more meaningful, the 2024 UWS Revenue Margin of 0.43% shown in Figure 2 has been calculated on a pro-forma basis including a full year contribution from Utmost Luxembourg. The reduction in UWS revenue margin from 2024 proforma to 2025 reflects the run-off of some high margin historic business and the impact of a significant number of very large cases written on more modest margins in the first half of 2025.
OPERATING PROFIT
Operating profit, as an APM, for 2025 was £224m. This compares to an operating profit of £176m for 2024. The primary driver of the increase in operating profit was the inclusion of Utmost Luxembourg in the 2025 results as well as foreign exchange gains and disciplined cost management across the Group.
OPERATING PROFIT MARGIN
UWS operating profit margin as an APM is calculated by dividing UWS operating profit by a measure of UWS revenue that includes the UWS net financial result and the investment return earned on UWS shareholder net assets and the shareholders’ share of the interest earned on UWS transaction account assets. For 2025 UWS operating profit was £230m and this is divided by total UWS revenue of £495m to give a UWS operating profit margin of 46%. The equivalent figure for 2024 was 48% which is not on a proforma basis for Utmost Luxembourg.
VALUE OF NEW BUSINESS
VNB, as an APM, is a measure of the profitability of new business written after allowing for the cost of administering it. VNB is calculated on an economic basis, consistent with the Solvency II balance sheet. In 2025, the Group’s VNB was £83m, a 41% increase compared to the 2024 VNB of £59m (in each case excluding VNB generated by the Group’s discontinued ULP operations). The increase in VNB reflects the inclusion of Utmost Luxembourg in 2025 and strong organic growth.
ULP VNB was £5m in 2025 (2024: £4m) includes both the contribution from successful Bulk Purchase Annuity transactions over the year and from Pensions Drawdown business.
SOLVENCY II ECONOMIC VALUE
SII EV, as an APM, is the Group’s preferred measure of the economic value of the business.
For the operating life companies, SII EV is largely derived from components of the Solvency II balance sheet and the calculation methodology results in an outcome which is broadly equivalent to an old style “market consistent embedded value” before allowance for the cost of non-hedgeable risks.
For all other entities, the SII EV is the IFRS NAV.
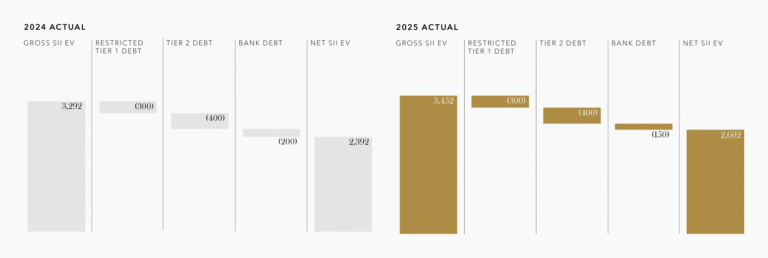
The Group SII EV (net of debt) increased from £2,392m at 31 December 2024 to £2,602m at 31 December 2025, as shown in Figure 3 below. The most significant influences on this increase in net SII EV were:
- VNB of £88m (including the £5m contribution from ULP);
- the payment of £34m of coupons on the Group’s Tier 2 and Restricted Tier 1 (“RT1”) notes and £13m of interest on the bank senior debt facility;
- dividends paid of £100m; and
- other underlying operational and market impacts of £269m.
The underlying operational and market impacts of £269m reflected the better performance of investment markets in 2025, offset by the closure of the Irish domestic UCS business.
The Group’s economic debt ratio at YE 2025 was 24.6% (YE 2024: 27.3%) which is within our 20%-30% gross SII EV target range.
IFRS PROFIT AFTER TAX
The Group’s IFRS profit after tax (“IFRS PAT”) for 2025 is £20m, compared to £556m in 2024, as reported in the financial statements. In both cases these figures exclude the profit after tax of the ULP business which is now shown separately as a profit from discontinued operations.
IFRS PAT includes one-off items such as acquisition and integration expenses and gains arising on bargain purchase when an acquisition completes, as well as the amortisation of acquired value of in-force business (“AVIF”) over time. The 2025 IFRS PAT reflects the amortisation of £138m of AVIF compared to £105m in FY 2024. The increase in amortisation is a result of the Utmost Luxembourg AVIF.
The amortisation schedule in relation to AVIF tends to be front end loaded so that, in the absence of further acquisitions, the charge in relation to AVIF amortisation would be expected to reduce in future years, bringing the IFRS PAT closer to operating profit all other things being equal.
The main reason for the substantial decrease in IFRS PAT in 2025 is that in 2024 there was a £509m gain on bargain purchase in relation to the acquisition of Utmost Luxembourg. There was no gain on bargain purchase in the 2025 financial statements.
Due to the impact of one-offs in the calculation of IFRS PAT, the directors consider operating profit to be the key performance indicator of the Group’s profitability for internal purposes, and review IFRS PAT as a further financial metric of profitability.
IFRS EQUITY
The IFRS equity of the Group decreased from £1,632m at 31 December 2024 to £1,602m at 31 December 2025. These figures are both net of the Company’s Tier 2 notes but are not net of the RT1 notes, as the latter are treated as equity for IFRS purposes. IFRS equity is also calculated net of the Contractual Service Margin (“CSM”) on insurance business under IFRS 17.
The £30m decrease in IFRS equity during 2025 primarily reflects the £100m of dividends paid during the year offset by IFRS profit after tax of £25m (including the contribution from the discontinued ULP operations) and a £58m increase in the foreign currency translation reserve.
Positive experience and new business have increased the net CSM. New business CSM is expected to be volatile as UWS products, typically classified as investment contracts under IFRS 9, are only classified as insurance contracts under IFRS 17 when certain riders or benefits are added. As the CSM only includes insurance contracts the Group’s preferred new business metric is VNB.
The Group’s net (of reinsurance and tax) CSM, excluding CSM in respect of the discontinued ULP operations, increased by £15m from £69m at FY 2024 to £84m at FY 2025. It remains the case that approximately 10% of the Group’s business is classified as “Insurance Business” under IFRS accounting standards. It is only this small minority of the Group’s business that is therefore subject to IFRS 17. As a result, the Group’s net (of reinsurance and tax) CSM is relatively small compared to the overall size of the Group’s IFRS liabilities.
Fitch Ratings (“Fitch”) uses “Adjusted Shareholders’ Equity” for the purpose of calculating the Fitch financial leverage ratio. The adjustments add back both the Group’s net CSM and the fund for future appropriations (“FFA”) in the ULP business as shown in the table below.
| FY 2025 £m |
FY 2024 £m |
|
|---|---|---|
| Reported IFRS equity | 1,602 | 1,632 |
| Group net CSM (including in respect of ULP) | 121 | 105 |
| ULP FFA | 65 | 62 |
| Adjusted shareholders’ equity | 1,788 | 1,799 |
The Fitch financial leverage ratio decreased slightly to 23.5% at 31 December 2025 from 25.0% at 31 December 2024, remaining well within the range appropriate for the ratings currently assigned to the Group by Fitch.
EXPENSES
On an actual basis, as included in the consolidated financial statements, administrative expenses (including commission expenses) were £61m higher at £277m in 2025 compared to £216m in 2024, with a breakdown in the table below.
This increase largely reflects the inclusion of the Utmost Luxembourg expenses in 2025 for the first time. The increase also reflects inflationary pressures and expenses related to the acquisition of what is now Utmost Luxembourg offset by the delivery of further synergies related to the integration of the Group’s businesses.
| 2025 £m |
2024 £m |
|
|---|---|---|
| Operating expenses | 246.4 | 172.8 |
| Depreciation/Amortisation | 9.4 | 3.7 |
| Development expenses | 21.4 | 14.8 |
| TOTAL | 277.2 | 191.3 |
Cost control remains a key pillar of our Target Operating Model and will continue to create operational savings and drive synergies throughout the business in the coming years.
OPERATING CASH GENERATION
Group operating cash generation in 2025 was £177m, compared to £142m in 2024 (with both figures excluding any contribution from ULP). Operating cash generation is calculated as operating profit less the cost of interest payments on the senior bank facility and both the Tier 2 and RT1 notes. The latter were unchanged over the year. The change in operating cash generation therefore simply reflects the additional cost of interest on the senior bank facility and the increase in Group operating profit compared to 2024.
HOLDING COMPANY CASH
Cash is held at the holding company level to cover GHO costs and one year’s interest costs on the Group’s debt capital instruments and the senior bank facility, in each case net of available tax relief. Excess cash not required for these purposes is available to be reinvested in the business, to fund future acquisitions, or to be paid as a dividend to the Group’s immediate shareholder, UHGL.
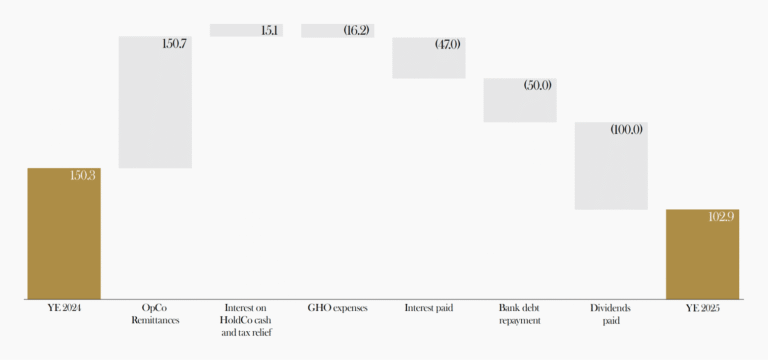
Cash held at holding companies at 31 December 2025 was £103m compared to £150m at 31 December 2024. An analysis of the change in cash held at holding companies over the period is shown in Figure 4 below. £151m of cash remittances were received from operating companies during the period. £50m of these proceeds were utilised to reduce the senior bank facility, with further amounts covering GHO expenses and interest. £100m of dividends were paid to UHGL during 2025, and £50m of the £103m of cash held at holding company level on 31 December 2025 was subsequently paid up to UHGL as a dividend in February 2026.
CAPITAL STRENGTH AND SOLVENCY POSITION
The Group applies a disciplined approach to capital management. The Group aims to maintain a strong capital position and has prudent capital policies in place. Each of its life companies is subject to local solvency regulation.
ULP and the Group are subject to the requirements of PRA Solvency II. Utmost PanEurope (“UPE”) and Utmost Luxembourg S.A. (“ULux”) are subject to the requirements of EIOPA Solvency II. The Isle of Man solvency regime is broadly similar to the PRA Solvency II regime and, in addition to complying with the Isle of Man solvency regime, the Isle of Man business also calculates its solvency coverage in accordance with PRA Solvency II requirements. The Group has agreed with the Guernsey Financial Services Commission (“GFSC”) that the capital position of UW and Utmost PCC Limited should be calculated in accordance with the PRA Solvency II requirements.
The nature of the business written by the Group is such that it is appropriate for all its life company subsidiaries to determine their Solvency II balance sheets using the “Standard Formula” approach to determine its Group Solvency Capital Requirement (“SCR”). The Group does not therefore currently utilise an internal model. The Group Solvency Coverage Ratio is calculated as Group Own Funds as a percentage of Group SCR.
The Group’s life companies seek to maintain a strong solvency position and have each adopted capital policies to ensure that this is the case. The capital policies for the various life companies within the Group are summarised in Figure 5 together with their actual Solvency Coverage Ratios as at YE 2025. The Solvency Coverage Ratio of each entity at 31 December 2025 was in excess of its target capital level, as shown in Figure 5.
UW and Utmost International Isle of Man (“UIIOM”) are also required to ensure that they meet the regulatory capital standards in respect of each of their branches.
The Utmost Group is subject to full Group-level supervision by the PRA at Utmost Group plc level. OCM Utmost Holdings Ltd (“OUHL”), the ultimate parent company of the Group, is subject to group supervision by the PRA on an “Other Methods” basis. In addition, in the absence of an agreement between the UK and the EU on equivalence, the Luxembourg Commissariat aux Assurances (“CAA”) undertakes group supervision on an “Other Methods” basis of Utmost Topco Limited (“Topco”) and its subsidiaries. Topco is the immediate subsidiary of OUHL. There are no material differences between the “Other Methods” reporting to the PRA and the CAA and the full Group reporting undertaken by UGP. Utmost’s European holding company, Utmost Holdings Europe S.à r.l. is also subject to full Group-level supervision by the CAA on an EIOPA basis.
Utmost’s approach to managing capital at Group level mirrors the approach at life company level, i.e. to maintain a Group solvency coverage ratio of at least 135% at all times, and a Group solvency coverage ratio of at least 150% immediately after payment of a dividend.
The Group had own funds of £2,887m and a Group solvency coverage ratio of 167% at YE 2025 as shown in Figure 6. It should be noted that the calculation of Group solvency for reporting to the PRA is calculated on the basis that the PRA calculation of the risk margin applies in all group entities. Group Own Funds are after allowance for a £50m foreseeable dividend which was subsequently paid in February 2026 as noted in the Holding Company Cash section above. Without allowance for the £50m foreseeable dividend, the YE 2025 Group Solvency Coverage Ratio would have been 170%.
The solvency coverage ratio reduced over 2025 in part due to the increase in the equity symmetric adjustment as equity markets performed more strongly than in recent years. The equity symmetric adjustment increases the equity capital requirements based on the current market level in comparison to the average.
In practice local solvency regulations apply in Ireland, Luxembourg and the Isle of Man and it is those that govern dividend capacity from the local entities up to group holding companies. The solvency position of UPE, ULux and UIIOM shown in Figure 5 are therefore calculated on the local solvency basis, not on the PRA basis.
A €25 foreseeable dividend is included in the UPE solvency position at YE 2025.
| ENTITY | Solvency Coverage Ratio 31 December 2025 |
At all times | Immediately Post dividend |
|---|---|---|---|
| Utmost International Isle of Man Limited | 200% | 125% | 150% |
| Utmost PanEurope dac (inc. shareholder funded WTA1) | 152% | 135% | 150% |
| Utmost PanEurope dac (exc. shareholder funded WTA1) | 127% | 100% | 110% |
| Utmost Luxembourg S.A. (inc. shareholder funded WTA1) | 141% | 135% | 150% |
| Utmost Luxembourg S.A. (exc. shareholder funded WTA1) | 141% | 100% | 110% |
| Utmost Worldwide Limited | 152% | 135% | 150% |
| Utmost PCC Limited | 170% | 135% | 150% |
| Utmost Life and Pensions Limited | 168% | 135% | 150% |
| Utmost Group plc | 167% | 135% | 150% |
Figure 5: Entity solvency and capital policies
| 2025 £m |
2024 £m |
|
|---|---|---|
| Own funds | 2,887 | 2,666 |
| Solvency capital requirement | 1,726 | 1,525 |
| Solvency coverage ratio | 167% | 175% |
Figure 6: Group solvency II capital
| 2025 £m |
2024 £m |
|
|---|---|---|
| Own funds | 2,887 | 2,666 |
| Solvency capital requirement | 1,726 | 1,525 |
| Solvency coverage ratio | 167% | 175% |
Figure 7: Utmost solvency position – 2025 actual
SENSITIVITY ANALYSIS
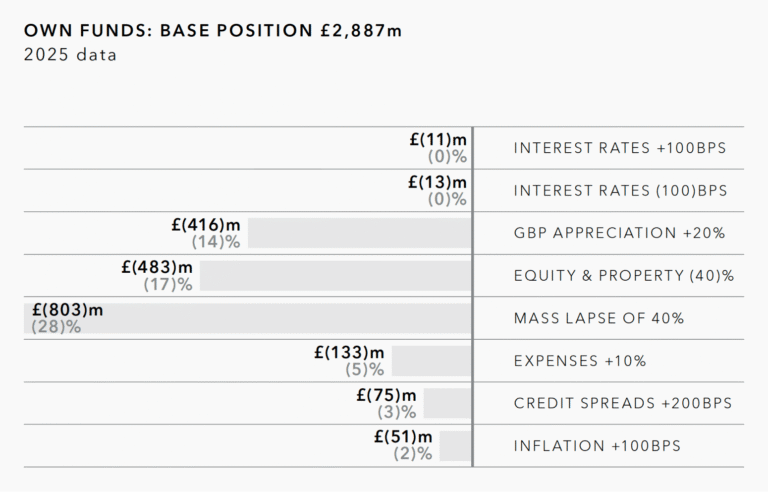
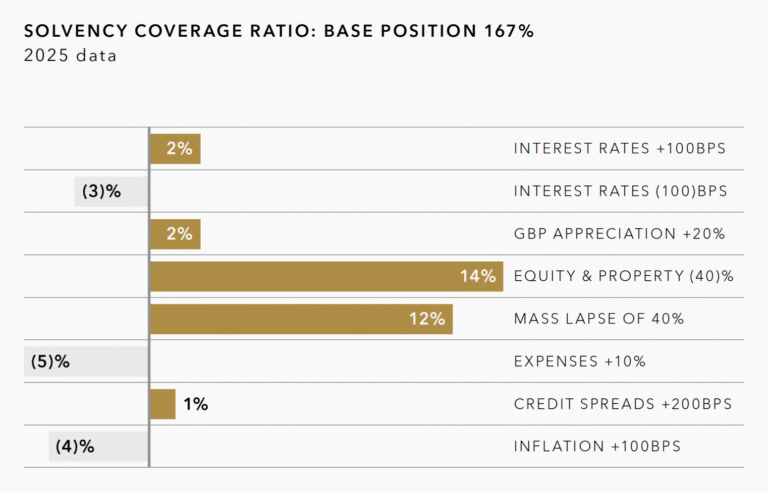
The Group has an extremely resilient solvency position due to the active management of key risks. Solvency coverage Ratios of each of our operating life companies, and of the Group itself, were very stable throughout 2025.
A large downward equity event, as experienced in 2022, reduces Own Funds but has a positive impact on solvency. The positive solvency impact is driven by three key areas: the life company NAV (or shareholder assets) being unaffected by the downward equity event, a reduced SCR arising from the resulting reduction in the equity symmetric adjustment and the mixture of fixed and AMC-based charges within the Group’s unit-linked business.
The primary risk that impacts the Group’s solvency and own funds adversely is expenses (including the impact of inflation on expense levels). Cost control remains a key pillar of our Target Operating Model. The Group also has exposure to lapse risk as most policyholders can switch their funds to another provider. Higher lapses reduce the own funds but increase the solvency coverage ratio as capital held against the switched funds is released. Similarly, lower lapses increase the own funds but reduce the solvency coverage ratio. In practice, lapse rates on the UWS unit-linked business which forms the vast majority of the Group’s in force business have historically been low, reflecting the long-term inheritance planning purpose for which many of the products are purchased.
Policyholder funds are invested across the globe in various currencies, with expenses primarily in pounds sterling and euros. An appreciation of pounds sterling reduces the VIF in alternative currencies, partially offset by a reduction in euro expenses, thereby reducing own funds. Capital held in association with the alternative currencies reduces in line with the reduction in VIF whilst the pounds sterling impacts remain unchanged.
The solvency sensitivities shown in Figures 8 and 9 take account of restrictions (if any) in the ability to count the RT1 loan notes or the Tier 2 loan notes as capital at Group level in the sensitivity concerned.
BORROWINGS
The Group has two external debt instruments in place: a £400m 4.0% Tier 2 loan note issued in September 2021 and a £300m 6.125% RT1 loan note issued in January 2022. Both instruments are listed on the Global Exchange Market (“GEM”) in Ireland.
In addition, the Group put in place a new £200m bank senior debt facility in December 2024 to part finance the acquisition of Lombard International. £50m of this facility was repaid during December 2025 such that the outstanding balance under the facility was £150m at YE 2025. Future repayments are £25m every six months from June 2026 until December 2028. However, it is anticipated that the remaining balance outstanding under the facility will in practice be repaid utilising part of the consideration received by the Group in respect of the sale of ULP.
The Group maintains a prudent capital structure and aims to target a leverage ratio between 20%–30% of SII EV, gross of debt. As at 31 December 2025, the leverage ratio on this measure was 24.6% (YE 2024: 27.3%).
CREDIT RATING
Fitch Ratings affirmed Utmost’s rated core insurance subsidiaries’ Insurer Financial Strength Ratings at “A+” and Utmost’s long-term Issuer Default Rating at “A”. The outlooks were stable as at the annual review in October 2025.
POST-BALANCE SHEET EVENTS
Utmost Group plc paid a £50m dividend to UHGL on 16 February 2026.
SUMMARY
The Group continued to make strong progress in 2025. Our balance sheet is strong and resilient, enabling us to provide a high level of security to our clients. Our strong financial position enabled the Group to invest in the continued organic growth of our business through the expansion of our distribution footprint, enhancements in client offerings and improvements in operational efficiency and technology infrastructure. The sale of Utmost Life and Pensions will enable increased strategic focus on our market-leading wealth solutions business and allow us to accelerate the repayment of the remaining balance under our senior debt facility. The strength of the Group is evidenced through the consistency of its financial strength, improved performance and growing scale of the business.

- Withholding tax asset as detailed further in note 16 of the consolidated financial statements in the UGP 2025 Annual Report
- The HoldCos own funds balance includes the elimination of a £20m intragroup Tier 2 loan

TAKE A CLOSER LOOK
Read the Full 2025 Annual Report
Get a comprehensive view of our financial performance, strategic milestones, and our vision for long-term growth.
Download annual report PDF